| Data Acquisition & Control 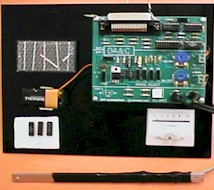
Let DPP show you how to interface to a computer. |
| Data Acquisition & Control
Let DPP show you how to interface to a computer. |
System Overview:
DA&C stands for Data acquisition & Control. It uses the printer port to send eight (8) outputs CONTROL lines from the PC parallel printer port to the project board. It receives five inputs lines from the project board back to the PC via the parallel printer port. The project board contains output latches, Input buffers. A/D converter (Analog to Digital Converter), Operational Amplifier, wheatestone bridge, Current meter, and a Solar cell.
There are three main experiments available for the DA&C project.
Experiment #1. IC tester - tests OR, NOR, AND, NAND, XOR logic gates. The program sends eight control lines to the IC that is plugged into socket # 2 of the project board, and receives a feedback from socket #2 back to the PC.
For experiments #2 & #3 the program uses an A/D converter to digitize the analog signals that are produced by the Operational Amplifier. A wheatestone bridge balances the amplifier. The Solar cell and the strain gauges sensors are connected to the bridge via a selector slide switch.
Experiment #2. Light intensity tester - measures light intensity and displays it with an external current meter (at the project fixture) also, the program displays a software simulated current meter and then plots a graph of intensity verses time.
Experiment #3. Pressure tester - measures the pressure exerted on a metal bar and displays it in the software with a pressure meter and plots a graph of pressure verses time.
Experiment #1 - IC tester.
| Slide switch A to position #1 | |
| Insert a logic gate that you wish to test into Socket 2 of the project board. | |
| Click on the | |
| Click on the desired IC logic gate to test: |
| AND | |
| OR | |
| NAND | |
| XOR |
| Red = digital 1 | |
| Black = digital 0. |
Experiment #2. Light Intensity Tester.
| Slide switch A to position 2. | |
| Slide Switch B to position 2. | |
| Select the light intensity option from the selector (right option.) | |
| On the project board select S3 and slide it to ON position (range selector for room ambient light intensity.) Cover the solar cell and adjust on the project board the zero level for the external meter. | |
| Uncover the solar cell and adjust Max level for the external meter. | |
| Click |
In order to adjust the simulated current meter in the program you must follow the next 2 steps:
1. Battery bias adjustment.
Background: The DA&C is using a single 9 volt battery which provides approximately 12 hours of continues use. The battery intensity and voltage level varies as its usage time progresses.
| Click | |
| For new battery click on the right arrow until output ports 1 to 4 are reds (digital 1.) |
As the battery becomes progressively weaker a smaller DC bias shall be needed.
The user can identify it if any difficulty shall arise in the next adjusting step thus, reduce the bias level.
| Click on the | |
| Uncover the solar cell and adjust the software-simulated meter and the graph level using the balance (white) potentiometer to about 80%-90% of maximum level. | |
| Cover the solar cell and observe how the simulated meter and the graph changing. |
The light intensity experiment enables you to perform various interesting scientific experiments. For example it can measure also the invisible frequency in the light spectrum such as for example infrared. You may try to aim your TV remote control and observe and study the reaction. DPP engineering has available an infra red modulated microphone. It modulates the intensity of an infra red light based on a voice level. The DA&C project can record it and then replay it and reproduce the audio sound.
Additional light intensity experiments that can be performed with the DA&C project are:
Experiment #3. Pressure tester
| Slide switch A to position 2 | |
| Slide switch B to position 1 | |
| Click on the left button of the selector for pressure | |
| Click on the left arrow to adjust the output port status to all blue (digital 0.) | |
| Click | |
| Adjust the simulated pressure meter and the graph using the balance (white) potentiometer to about the middle of the meter range. | |
| Bend the metal bar and observe drag and lift. |
Additional experiments can be performed using the DA&C pressure measurement:
Buttons & Functions

![]()
![]() To Record a
graph.
To Record a
graph.
![]() To Start the
DA&C and make it ready for the next test.
To Start the
DA&C and make it ready for the next test.
![]() To Replay a
recorded graph from memory.
To Replay a
recorded graph from memory.
![]() To select the
graph(s) to be displayed.
To select the
graph(s) to be displayed.
![]() To Reset the
graph to time = zero.
To Reset the
graph to time = zero.
Superimpose option. It provides multiple color graphs. Thus, a comparison between a real time graph acquisition versus a previously recorded graph is possible.
![]() To filter
noise that may put jitters on the graph.
To filter
noise that may put jitters on the graph.
![]() To view range
and domain setting (move the bar graph) and observe new ranges.
To view range
and domain setting (move the bar graph) and observe new ranges.
![]() To view the
status of the 8 parallel lines outputs (red -1, blue - 0.)
To view the
status of the 8 parallel lines outputs (red -1, blue - 0.)
![]() To view the
IC tester
To view the
IC tester
![]() To view the
software simulated meters.
To view the
software simulated meters.
![]() To Toggle
ON/OFF the background music.
To Toggle
ON/OFF the background music.
![]() To let the
program detect to which printer port (LPT#) is connected to.
To let the
program detect to which printer port (LPT#) is connected to.
![]() To Read About
the program.
To Read About
the program.
![]() To Exit from
the program.
To Exit from
the program.
| IBM PC compatible |
| CPU: 486- 66 MHz or faster. |
| VGA Monitor |
| Parallel Printer port |
| Windows 98, Windows 95 Or Windows 3.1 |